
Table of Contents
Using Data for News Analysis
Introduction
Background
Coronavirus, Black Lives Matter, USA-China trade wars. Does any of this ring a bell? Over the past three months we have undergone an unprecedented period of change. The way we work, interact and socialise has been completely altered. In other news, we have Black Lives Matter movement challenging institutional racism and prejudice, attempting to change the way we think about race. Then there are US-China trade wars. Did anyone mention the erratic behaviour of the stock market? What if we could run news analysis to get our heads around all of this?
Certainly, a lot has happened over the past three months and sometimes it can be difficult to keep track of the most important news. We could try to read all the articles from all the news outlets to keep on top of things. But who has time for that in our increasingly hectic world? This thought has sparked a new idea in my head. What if we tried to analyse the news using the power of data? What if we could see which topics are the most important and what is the general sentiment?
Well, this is what I want to write about today. In order to perform the news analysis, I took a representative sample everyday between 1st of March 2020 and 30th June 2020. Then I built a script in R language to pull news articles using NewsRiver API and then run analysis on the news. We will investigate which topics are the most important and what is the overall feeling about the news for the given week. Moreover, we will try to extract the underlying context of the different topics to try to pull out the real reason for news articles each week.
News Data Sources
I pulled the news data from the fantastic NewsRiver API . This fantastic API provides news articles from multiple news outlets around the world. The API also comes with different options you can use to query the data. For example, you can choose news with specific phrases, dates or even specific outlets.
For our purposes though, one incredibly useful feature for news analysis is the scoring system used by NewsRiver, which selects the most relevant news from the most important news outlets from around the world.
Few Words on the Analysis Script
In order to analyse the data, I developed an R script. The script pulls the data from NewsRiver API, groups the news articles into weeks these articles were published, and then runs analyses on those.
This program removes the so-called stop-words from each article, which are words that essentially add no value to the article analysis, such as “the”, or “at”. The script then uses the LDA model to detect the most important topic of each week and the underlying contexts. The script then scores words carrying a sentiment using AFINN lexicon. Then the program calculates the average sentiment in a given week as the mean sentiment per qualifying word.
The news analysis methods I am using are very much work in progress and I plan to improve upon portions of the script as I revisit the news analysis at regular intervals to capture the next 3 months. This way I plan to build, evolve and show you a robust method for news analysis! Should be fun!
LDA Model
The LDA model is so central to how I will identify the main topics covered in news articles that it deserves its own subsection!
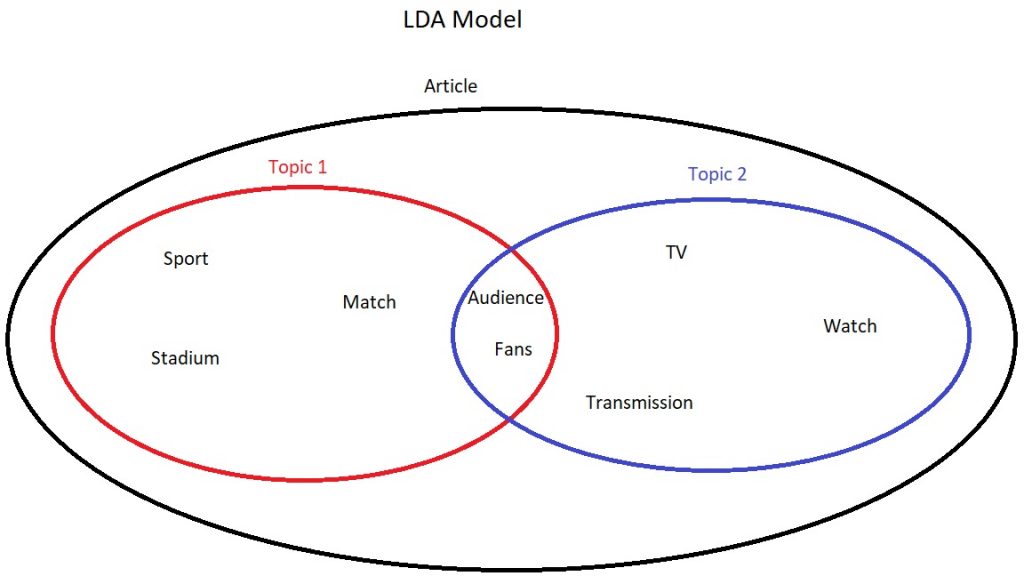
Latent Dirichlet Allocation (LDA) topic modelling is commonly used in news analysis to detect key words associated with the topic. This is an unsupervised model that tries to group words in an article into separate topics. Without going into some hardcore maths, the model makes two major assumptions during its search for key words.
- Every article is a mixture of topics – This assumption is important as the model actively recognises that the majority of articles may have several topics and themes intertwined.
- Every topic is a mixture of words – LDA model assumes that every topic consists of multiple words. The model also allows an overlap of words between topics. For example, imagine an article on a sport event. There may be one topic describing words related to the sport. The other topic may relate to television and fans. Both topics could contain words such as “audience”.
The model, taking into account these assumptions, assigns words to each topic and calculates a beta score. A beta score is essentially a score determining how likely it is that the given word belongs to the given topic. Long story short, a beta score can be treated as a general indicator of how strongly given words are associated with the topic.
News Analysis
Top Terms
In order to analyse the top terms, I relied mostly on the LDA model. The reason we should look at the top terms is to try to identify the most important topics discussed in the news.
Now, after some thinking I came up with two ways of distilling the articles into the top terms. The first method is the more classical method closely following widely used practices to identify top topics with the LDA model. The second method however is a method I was tinkering with to try to identify the top context behind the news. My thinking is to try identify the real underlying reason for the news.
First things first however, let’s have a look at the data relating to the top weekly topics for the March-June news. The articles used for this were the 100 most significant articles of each day in the English language as determined by the NewsRiver API scoring system.
Below, I included a description of how this part of the script works, if you are not interested in the nitty-gritty workings of the script, feel free to jump ahead of the boxed section!
The script attempts to use the LDA model to assign words to 5 topics per article. Those topics are then grouped into weeks based on the release of the article date. Then top 10 terms are selected for each topic based on the beta score. So, to recap, now we have a bunch of topics with ten terms in each. In each week group, a top topic is selected per each article based on the highest gamma score. A gamma score is generally a measure of how relevant the whole topic is to the article. Out of those top topics in each article, the top topic is selected based on how many articles it is most relevant to.
For graphing purposes, the top 5 terms from all the top topics from all the weeks are selected based on the highest beta scores.
Now that we know how the general script works, let’s have a look at the data itself, as it’s fascinating!
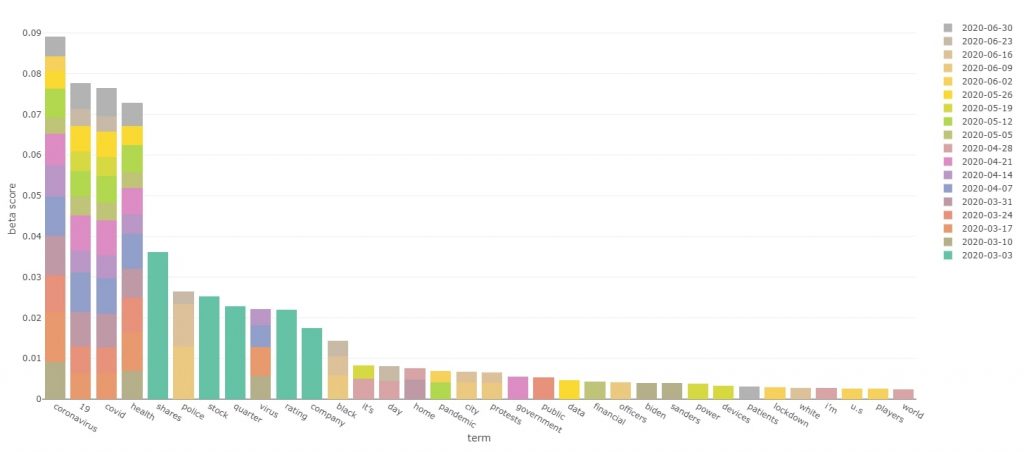
Interactive version of the top terms bar plot
From the first look at the chart it is quite clear that COVID 19 terms absolutely dominated the news in March-June. We have terms such as “coronavirus”, “Covid”, “19” and “health” all in the top 5. Judging by the colourful bar it is also apparent that those terms featured highly over the whole March-June time period.
While it was obvious from the beginning of this whole project, that coronavirus would feature strongly in the current times, there are other interesting facts that the bar plot is showing us!
For example, we can see that there is a lot of financial terms such as “shares”, “stocks” and “quarter” all featuring in the early march period. My take on this is that financial news is generally quite common. However, these terms got a “boost” when the financial impact of coronavirus was widely discussed. As time progressed, health impacts of coronavirus started to spark much more debate, whereas finances retreated to more of an underlying theme rather than the top directly discussed topic.
Another piece of news is covered by terms such as “police” and “black”. Those terms seem to be featuring strongly in June. These terms are very likely to be related to the Black Lives Matter movement and the murder of George Floyd.
Seeing as there are some interesting differences in the times at which certain terms are making it to top topics, let’s have a quick look at how the top terms change over time.
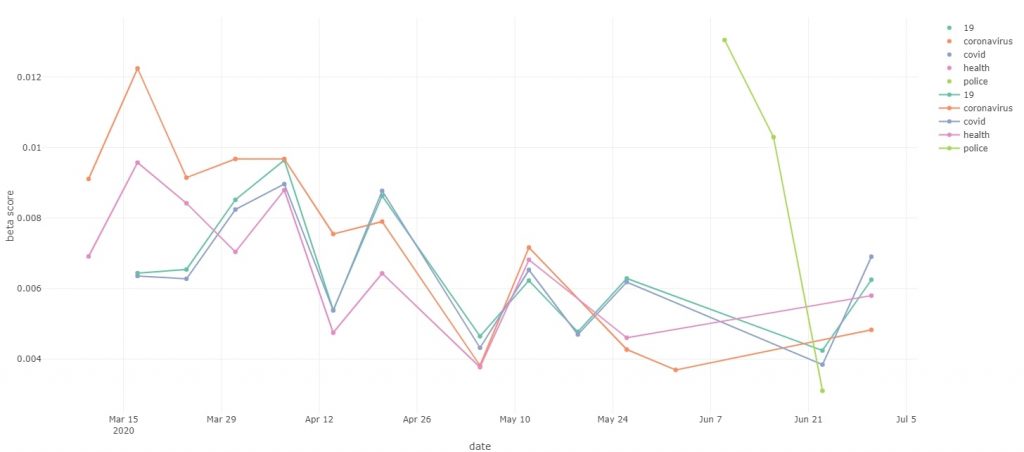
Interactive version of the top terms chart
For the readability of the chart, I included only the top five terms as shown on the top terms bar plot previously. The term “shares” was ignored as it does not feature in the top terms for more than one week.
The chart plots the beta score of each term whenever it features in the top topic. My reasoning behind this was to show how the importance of each term changes over time, as the beta score can be a rough indicator of how crucial a given term is to the topic.
The chart once again seems to be quite interesting! We can see how the COVID-19 related terms were at the forefront of the news in mid-March. Then we can see how those same terms have declined in their importance, even though coronavirus has not gone anywhere! I think the scores correlate quite well with the initial panic over the virus followed by easing off on the news about this issue.
The chart also covered the term “police”. We can see the term was really hot at the beginning of June, but its coverage in the news has quickly declined over the course of a single month. It is crazy how there is such a stark contrast between COVID-19 related terms retaining the interest of the media over 3 months, whereas the term “police” likely related to the BLM movement has dropped off in just one month.
However, at the beginning of June, the term “police” scored higher than any COVID-19 related terms over the whole 3 months. My little theory on this is that COVID-19 terms were initially used directly to describe the issue of the pandemic, hence having high beta scores. Then as the time went on the topic of COVID-19 was still widely covered, but more as a context and reasoning behind other things occurring, lowering the beta scores. On the other hand, BLM is a very focused topic and does not feature as widely as a context behind other topics. But this is just my take on this! I would be interested to see your takes on this. If you have a similar or different theory, don’t be afraid to contact me!
Top Context
So, we have looked at the top terms and learnt some interesting stuff. However, the topic analysis I carried out very much looks at the face value of the top terms of the week. This was apparent with the changes of popularity in the BLM related terms and even the COVID-19 related terms.
But what about the underlying context? What about the underlying themes? For example, over the past three months I read quite a few articles talking about the erratic behaviour of the stock market. Whilst the stock market behaviour was the main topic, COVID-19 was the driving force behind those changes, thus being the underlying theme.
This observation made me think on how could we identify those main themes? After some tinkering and experimenting, I finally came up with a method. This method is probably not something that is commonly used in data science community, so results have to be taken with a pinch of salt. Nonetheless the method does yield interesting results!
The way this method works is by looking at terms across ALL 5 topics identified by LDA model in each article. My reasoning behind this is that some terms will score highly on their specific topic, but will also feature with the lesser scores in other topics listed by the LDA model. By adding up those scores, we can deduce which terms feature as a context, or intertwined theme, rather than just focusing on the top terms of the top topic.
The script works in a similar way as the first method for top terms. However, the script scores the terms differently. This time around, the script calculates the sum of the beta scores for each term across all the topics. Then the sum is multiplied by the number of times the term is featured in the topics in a given week. This is done to tilt the algorithm to favour the terms that appear in multiple topics. For example, let’s imagine the term “hospital” appears in two topics in the week, with beta scores of 0.08 and 0.01. The sum of beta scores is then 0.09. This is then multiplied by 2 (due to 2 appearances) to give an overall score of 0.18.
I believe this method gives us a good balance for finding out the context of the news. On one hand, this method favours terms that appear in multiple topics. However, it also makes sure that the terms have a reasonable beta score in some of those topics as to avoid overly generic terms that would appear often, but would not be very helpful. Also, to avoid overly generic terms, the 3 top terms per week are used for graphing purposes.
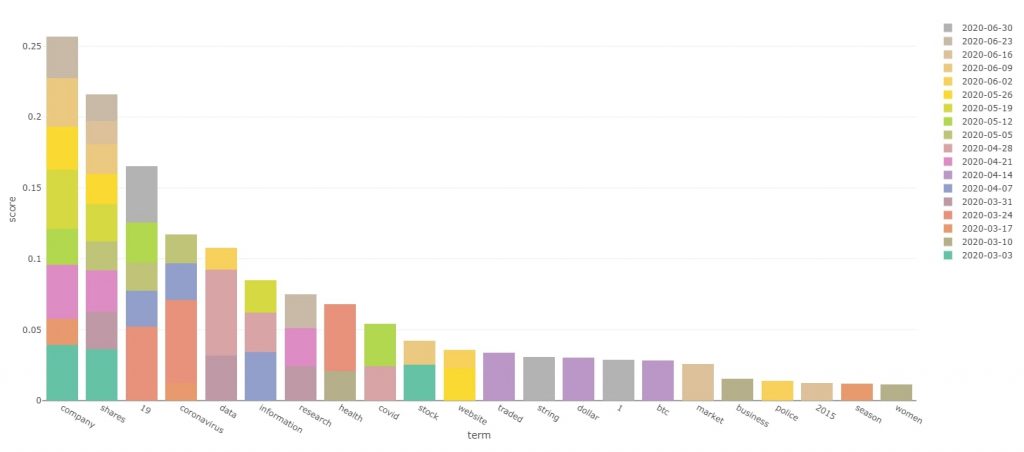
Interactive version of top contexts bar plot
The data shows us some awesome information! We can see that the top 2 terms “company” and “shares” are finance and economy related. Next two terms are COVID-19 related. It is quite clear that the economy and COVID-19 were the main intertwined themes. We have seen plenty of economic news as a result of COVID-19, as well as COVID-19 impacting other aspects of life such as work, or events.
It is interesting to see the breakdown of the scores over the weeks. The top two financial terms were somewhat relevant as context throughout most of the time period covered. On the other hand, COVID-19 was a highly relevant context towards the end of March, whilst being less of an overriding theme as time progressed.
The graph also seems to explain my theory on the quick spike and drop in BLM related terms when studying the previous method. In the context analysis “black” does not feature at all and “police” is near the back of the bar plot. This shows that these terms whilst important, are unlikely to be the underlying context for news covering something else.
Sentiment Analysis
Now that we know the general trending topics, we need to have a look at how the news outlets felt about those topics. This is where sentiment analysis comes in. It is a method for us to see whether the topics we covered were perceived as positive, or negative. Quite fascinating revelations will unfold!
The method for sentiment analysis is currently fairly simplistic and I will certainly give this area of the script some love over time.
Currently the analysis revolves around the AFINN lexicon. It is essentially a huge table of words that carry a sentiment and those words are assigned a score. The score for each word can range from -5 to +5. Negative 5 denotes very negative words and +5 is assigned to very positive words. Every other word in the lexicon is scored on the spectrum depending on how “strong” the word is. For example, “annoying” has a score of -2, whilst “terrible” has a score of -3.
And yes, many expletive terms are also included, with predictably negative scores…
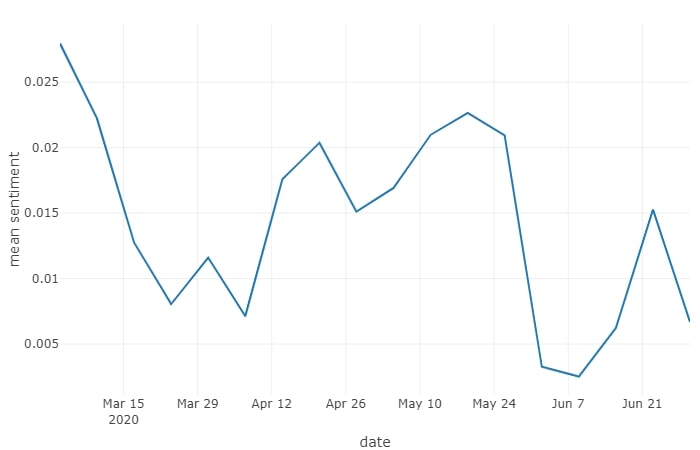
Now, onto the actual processing of these scores. The articles were taken apart into single words and the stop words were removed. The remaining words were scored according to the lexicon. Then the script sums all the scores for all the words in each article, giving an aggregated score. Finally, the resultant score is divided by the number of qualifying words in the article to keep the comparison fair in articles of differing lengths. The scores shown on the chart below are average sentiment scores for all the analysed articles in a given week.
 Interactive version of the sentiments chart
The chart looks pretty interesting. We can see a big drop in the mean sentiment score in March, which is likely to be triggered by the COVID-19 pandemic. Then, as COVID-19 slowly drops from the forefront of the news to a more background position, the sentiment starts picking up again.
However, this seems to be short-lived, as the sentiment drops again in June, possibly due to the spotlight on police racism and brutality brought about by the Black Lives Matter movement. The following protests could have also triggered some words with negative sentiments as such a strong issue is being discussed.
We do need to bear in mind that as it stands, my script is quite simple and prone to bias due to the innate AFINN lexicon bias, as well the tendency for news to sensationalise issues. Therefore, I think it is much more important to look at how the sentiment value changes over time, rather than just looking at the absolute values on the chart. What I mean by this is, that it is probably more accurate to judge whether the news became more positive, or negative, rather than whether the news is positive or negative in absolute terms.
Few Final Words on News Analysis
I hope you enjoyed reading this post as much as I enjoyed writing it! This is certainly something I will build on by improving the script to provide more robust news analysis. I am very curious as to what news and relationships we will unearth next time!